
History and Development of Water in the West
Dr. Paul Lander from the University of Colorado Boulder gives a lecture on the history of water resources in the Western United States, from the pre-colonial time period onward. This video is part of the Water in the Western US lecture series.

Review of the Water Cycle (with a focus on the Western US)
In this video Dr. Anne Gold and Eric Gordon give a brief review on the different processes involved in the water cycle, specifically in the Western United States.
Geography of the West
Eric Gordon and Dr. Anne Gold give an overview on the geographic features that define the Western United States, both physical and political.

Important Things to Know About the Course
Eric Gordon and Dr. Anne Gold give an overview on the basics of the various subjects covered in the Water in the Western US lecture series.

Why Study Water in the West?
This video serves as an introduction to the Water in the Western US lecture series. The instructors Dr. Anne Gold and Eric Gordon explain the importance of learning about water in the Western United States.
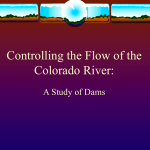
Controlling the Flow of the Colorado River
Students will learn about the Colorado River and human efforts to control water flow. Students will then research other water management efforts throughout the country and report their findings.
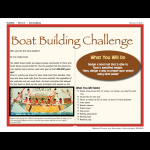
Boat Building Challenge
Use aluminum foil to make boats and then test designs by seeing how many pennies or paperclips they can hold.
A Drop in Your Hand - Water Stewardship Activity
See the relative volume of water available that is clean, safe, and available to drink.
Can You Catch The Water?
Students construct three-dimensional models of water catchment basins using everyday objects to form hills, mountains, valleys and water sources. They experiment to see where rain travels and collects, and survey water pathways to see how they can be altered by natural and human activities. Students discuss how engineers design structures that…
All About Water!
Students learn about the differences between surface and ground water as well as the differences between streams, rivers and lakes. Then, they learn about dissolved organic matter (DOM) and the role it plays in identifying drinking water sources. Then students are introduced to conventional drinking water treatment processes by developing and…
Sharing a River - The Colorado River Story
In Lab 4, students take a journey to the Colorado River Basin near Lees Ferry. They explore aspects of the Colorado River Basin using a variety of resources, interactive maps, and tools such as Google Maps. This journey give them perspective on the scope of the watershed and how various stakeholders have siphoned the water from the river to serve…
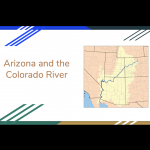
Arizona and the Colorado River
In this activity, students will learn about the dams and major cities on the Colorado River. They will research why the dams were built and discuss how hydrology plays such a great part in the geography of Arizona. This lesson has strategies for diverse learners (ELLs).
The Colorado River Water Story
The Colorado River watershed has always been a subject of great interest and concern. It provides agricultural irrigation and drinking water to farms and cities in seven southwestern states. The intention of this exercise is to be a southwestern regional perspective of a changing climate. You’ll be graphing snowpack in the Colorado Rocky Mountains…
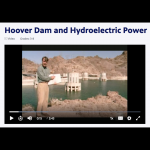
Hoover Dam and Hydroelectric Power
Since its completion, Hoover Dam has wowed visitors with its sheer massiveness and its ability to create and hold back a reservoir that covers nearly 650 square kilometers (250 square miles). Yet, perhaps even more impressive is the dam's ability to harness the potential energy stored in the reservoir and convert it to electricity. In this video…
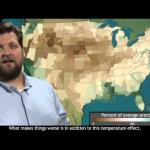
Baking the Bread Basket: Drought in the Heartland
From scorching July heat to well-below-average summer rainfall, NOAA’s Deke Arndt, Chief of the Climate Monitoring Branch at the National Climatic Data Center, recaps summer climate conditions across the United States. Running time: 3:02

Drought in the Colorado River Basin
This application was developed by the U.S. Geological Survey and the Bureau of Reclamation in support of the Department of the Interior’s Open Water Data Initiative (OWDI). This visualization is part of a multi-agency effort to showcase the usefulness of open data (i.e., data provided in a discoverable, sharable, and machine-readable…
The Hardest Working River in the West
This is a StoryMap on the Colorado River. The story map details the history of the Colorado River, water resources, river management, and tools for managing in the future.

Drought Data and Projections
This resource includes 3 videos that are animations of drought data. The first is an animation of the US Drought Monitor drought index snapshots from 2010-2018. The second is an animation of global drought data from satellites from 2013-2018. The third is an animation of drought projections for the US from 1950-2095.
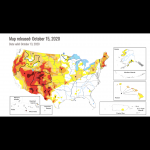
U.S. Drought Monitor
This is a real-time map of current drought conditions in the US, which can be zoomed to the state level, with access to many more resources at that level. Some of these include the National Drought Regional Summaries and animations of historical data.
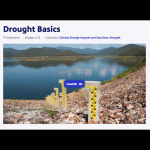
Drought Basics
This PBS Learning Media activity addresses drought basics, including its causes and impacts and ways to assess it, by using media from NOAA and NASA. It defines the types of drought, the impacts, monitoring, and responses to drought. Use this resource to stimulate thinking and questions on the complexity of drought and to identify some variables…

SciJinks: Precipitation Simulator
A computer simulator that allows students to adjust the air temperature and dew point to see what type of precipitation would fall to the ground.
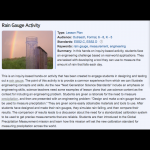
Rain Gauge Activity
In this hands-on inquiry-based activity, students face an engineering challenge based on real-world applications. They are tasked with developing a tool they can use to measure the amount of rain that falls each day. This is more of a mini unit than a stand alone activity. This activity takes one to three 60 min class periods. Additional…
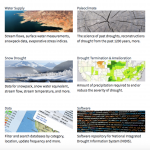
National Integrated Drought Information System: Data, Maps and Tools
This is a extensive collection of maps, data, and tools that students can use to research drought and its impacts on agriculture, wildfires, water supply, vegetation, soil moisture, temperature and precipitation.
Too Much, Too Little
This video describes the joint NASA-JAXA GPM (Global Precipitation Measurement) satellite mission and why it is necessary for monitoring precipitation around the Earth. It also discusses the science around issues of having too much or too little precipitation such as landslides and drought. It emphasizes the need for data to fill in gaps, and why…
Assessing Drought in the United States
This easy-to-understand video animation describes drought and explains the different categories of drought used by the drought monitor. It discusses the effects of and contributions to drought, what the implications of the different drought levels are, and puts the drought maps into context to understand how the impacts vary geographically (e.g.…