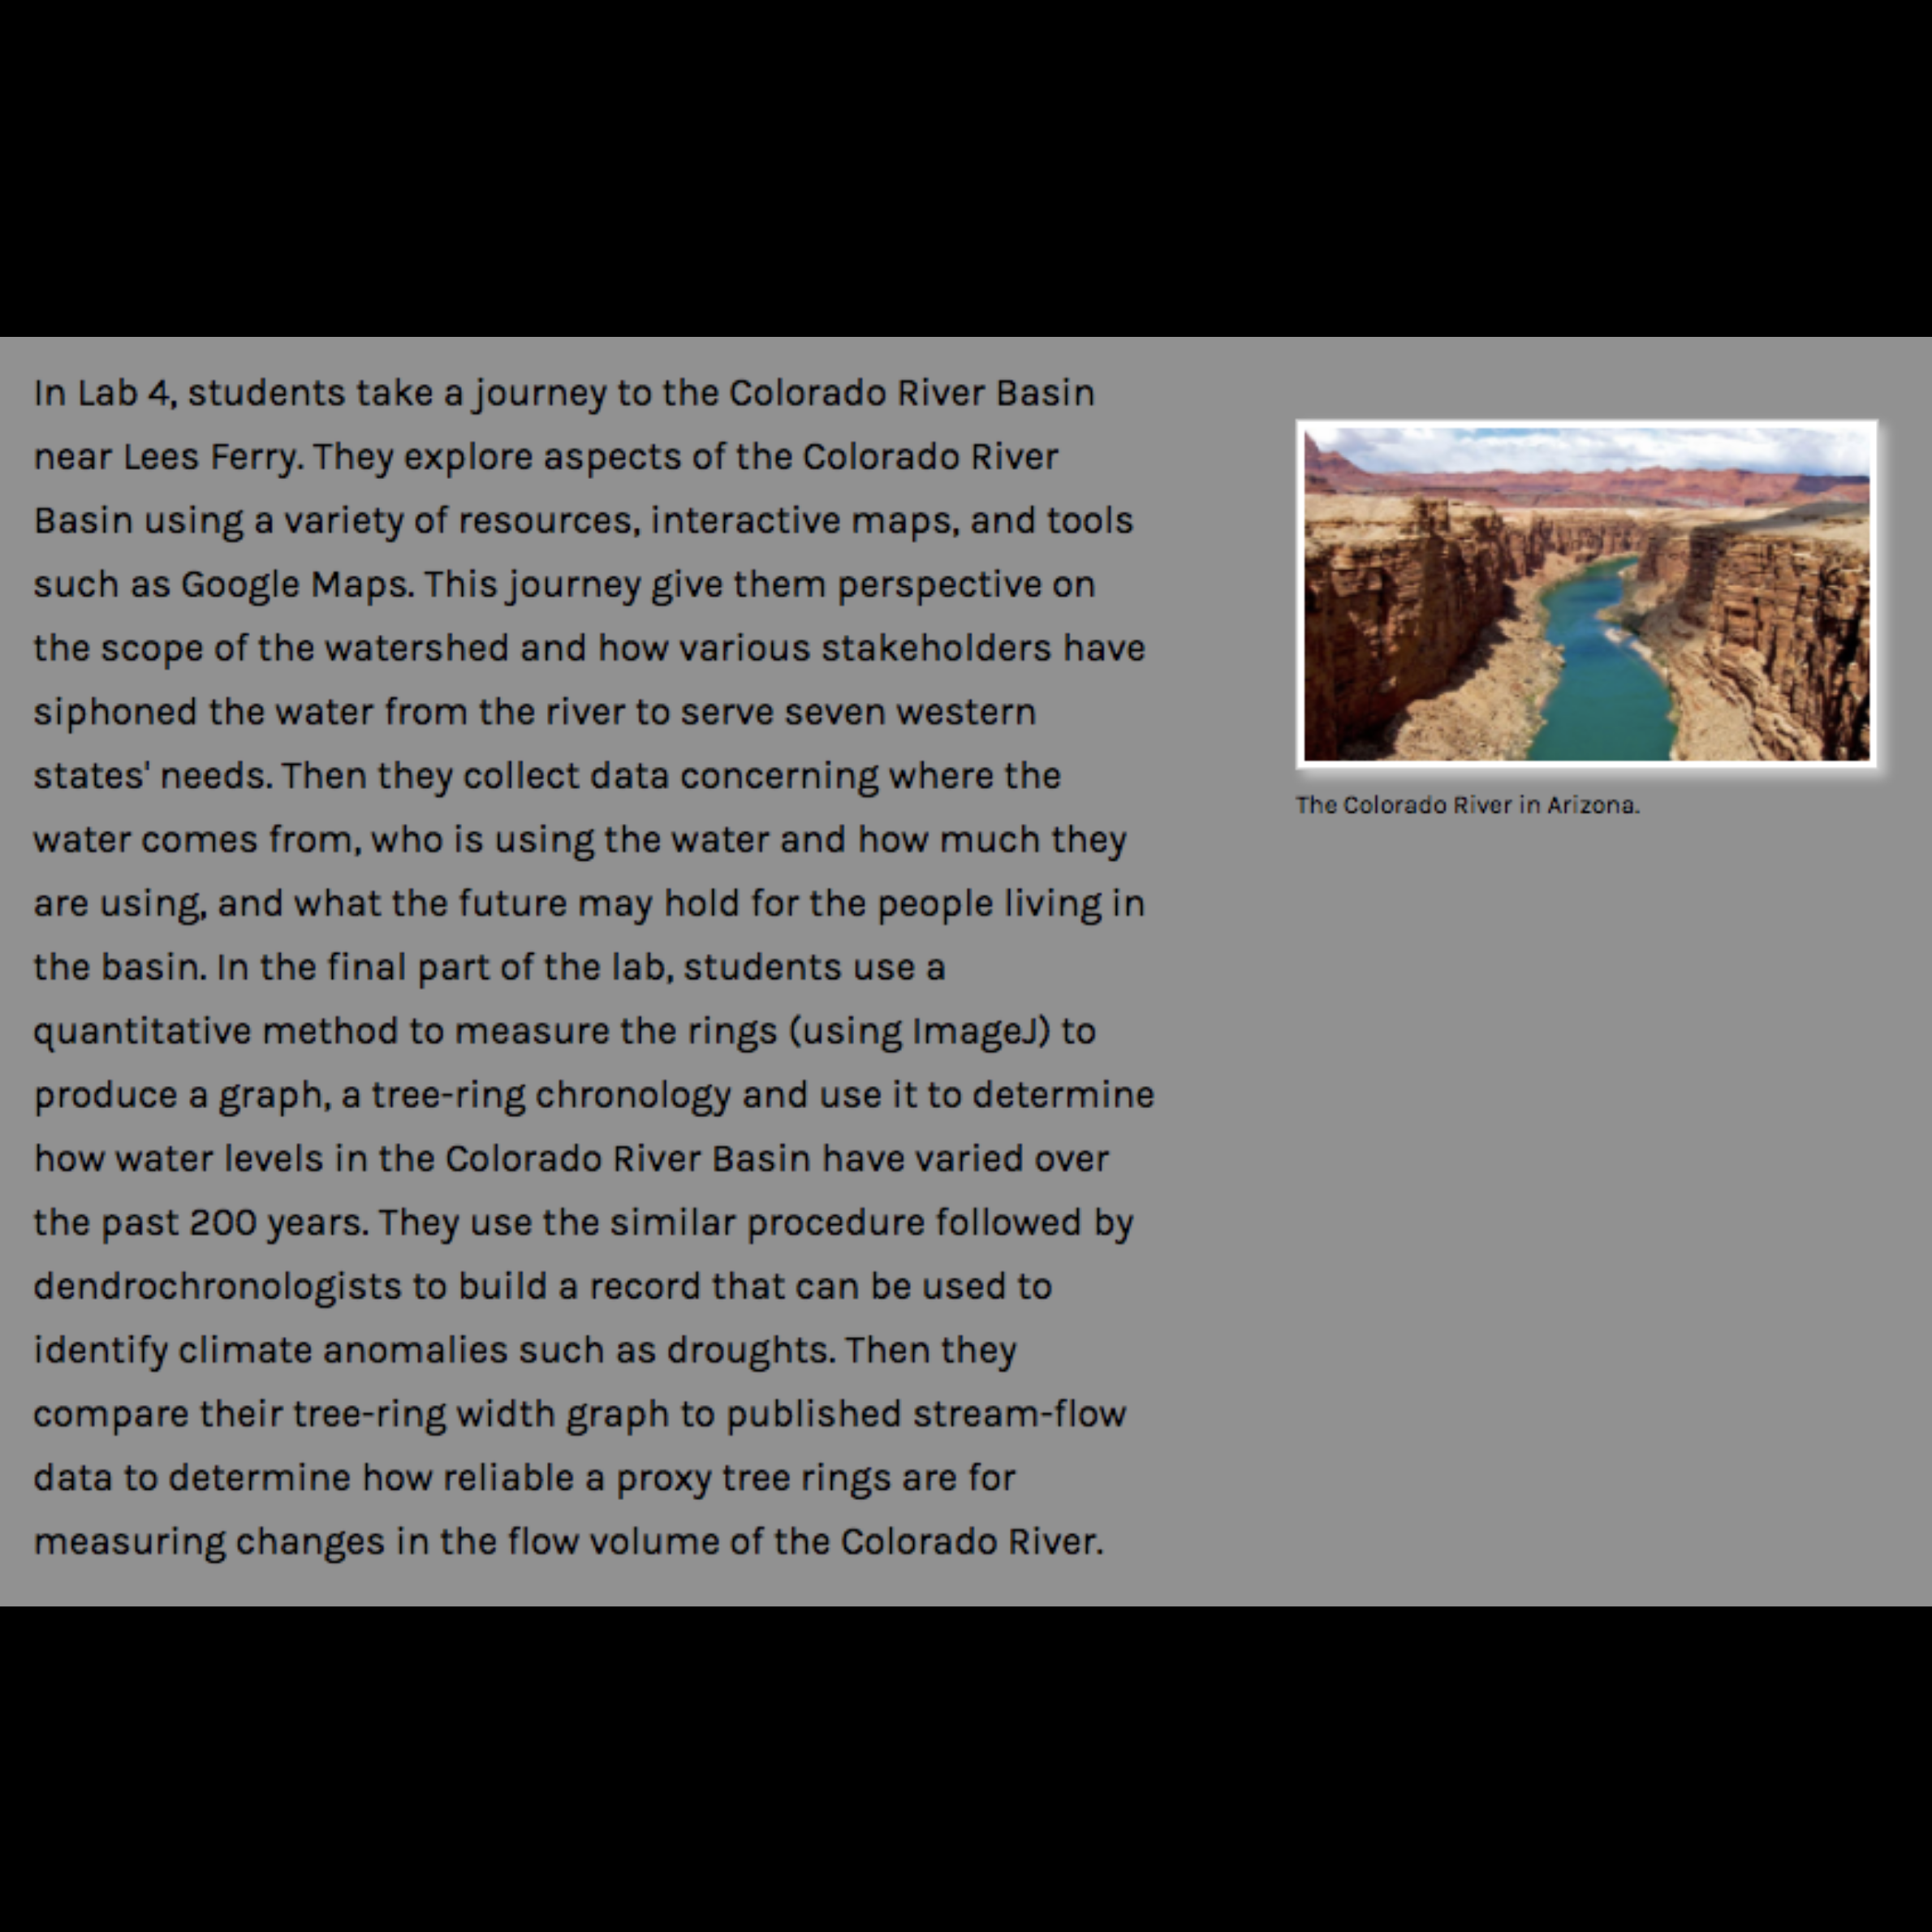
In Lab 4, students take a journey to the Colorado River Basin near Lees Ferry. They explore aspects of the Colorado River Basin using a variety of resources, interactive maps, and tools such as Google Maps. This journey give them perspective on the scope of the watershed and how various stakeholders have siphoned the water from the river to serve seven western states' needs. Then they collect data concerning where the water comes from, who is using the water and how much they are using, and what the future may hold for the people living in the basin. In the final part of the lab, students use a quantitative method to measure the rings (using ImageJ) to produce a graph, a tree-ring chronology and use it to determine how water levels in the Colorado River Basin have varied over the past 200 years. They use the similar procedure followed by dendrochronologists to build a record that can be used to identify climate anomalies such as droughts. Then they compare their tree-ring width graph to published stream-flow data to determine how reliable a proxy tree rings are for measuring changes in the flow volume of the Colorado River.
What does water mean to you and your community?
Share your stories and perspectives about water in your community.
You can upload photos, videos, or text here.