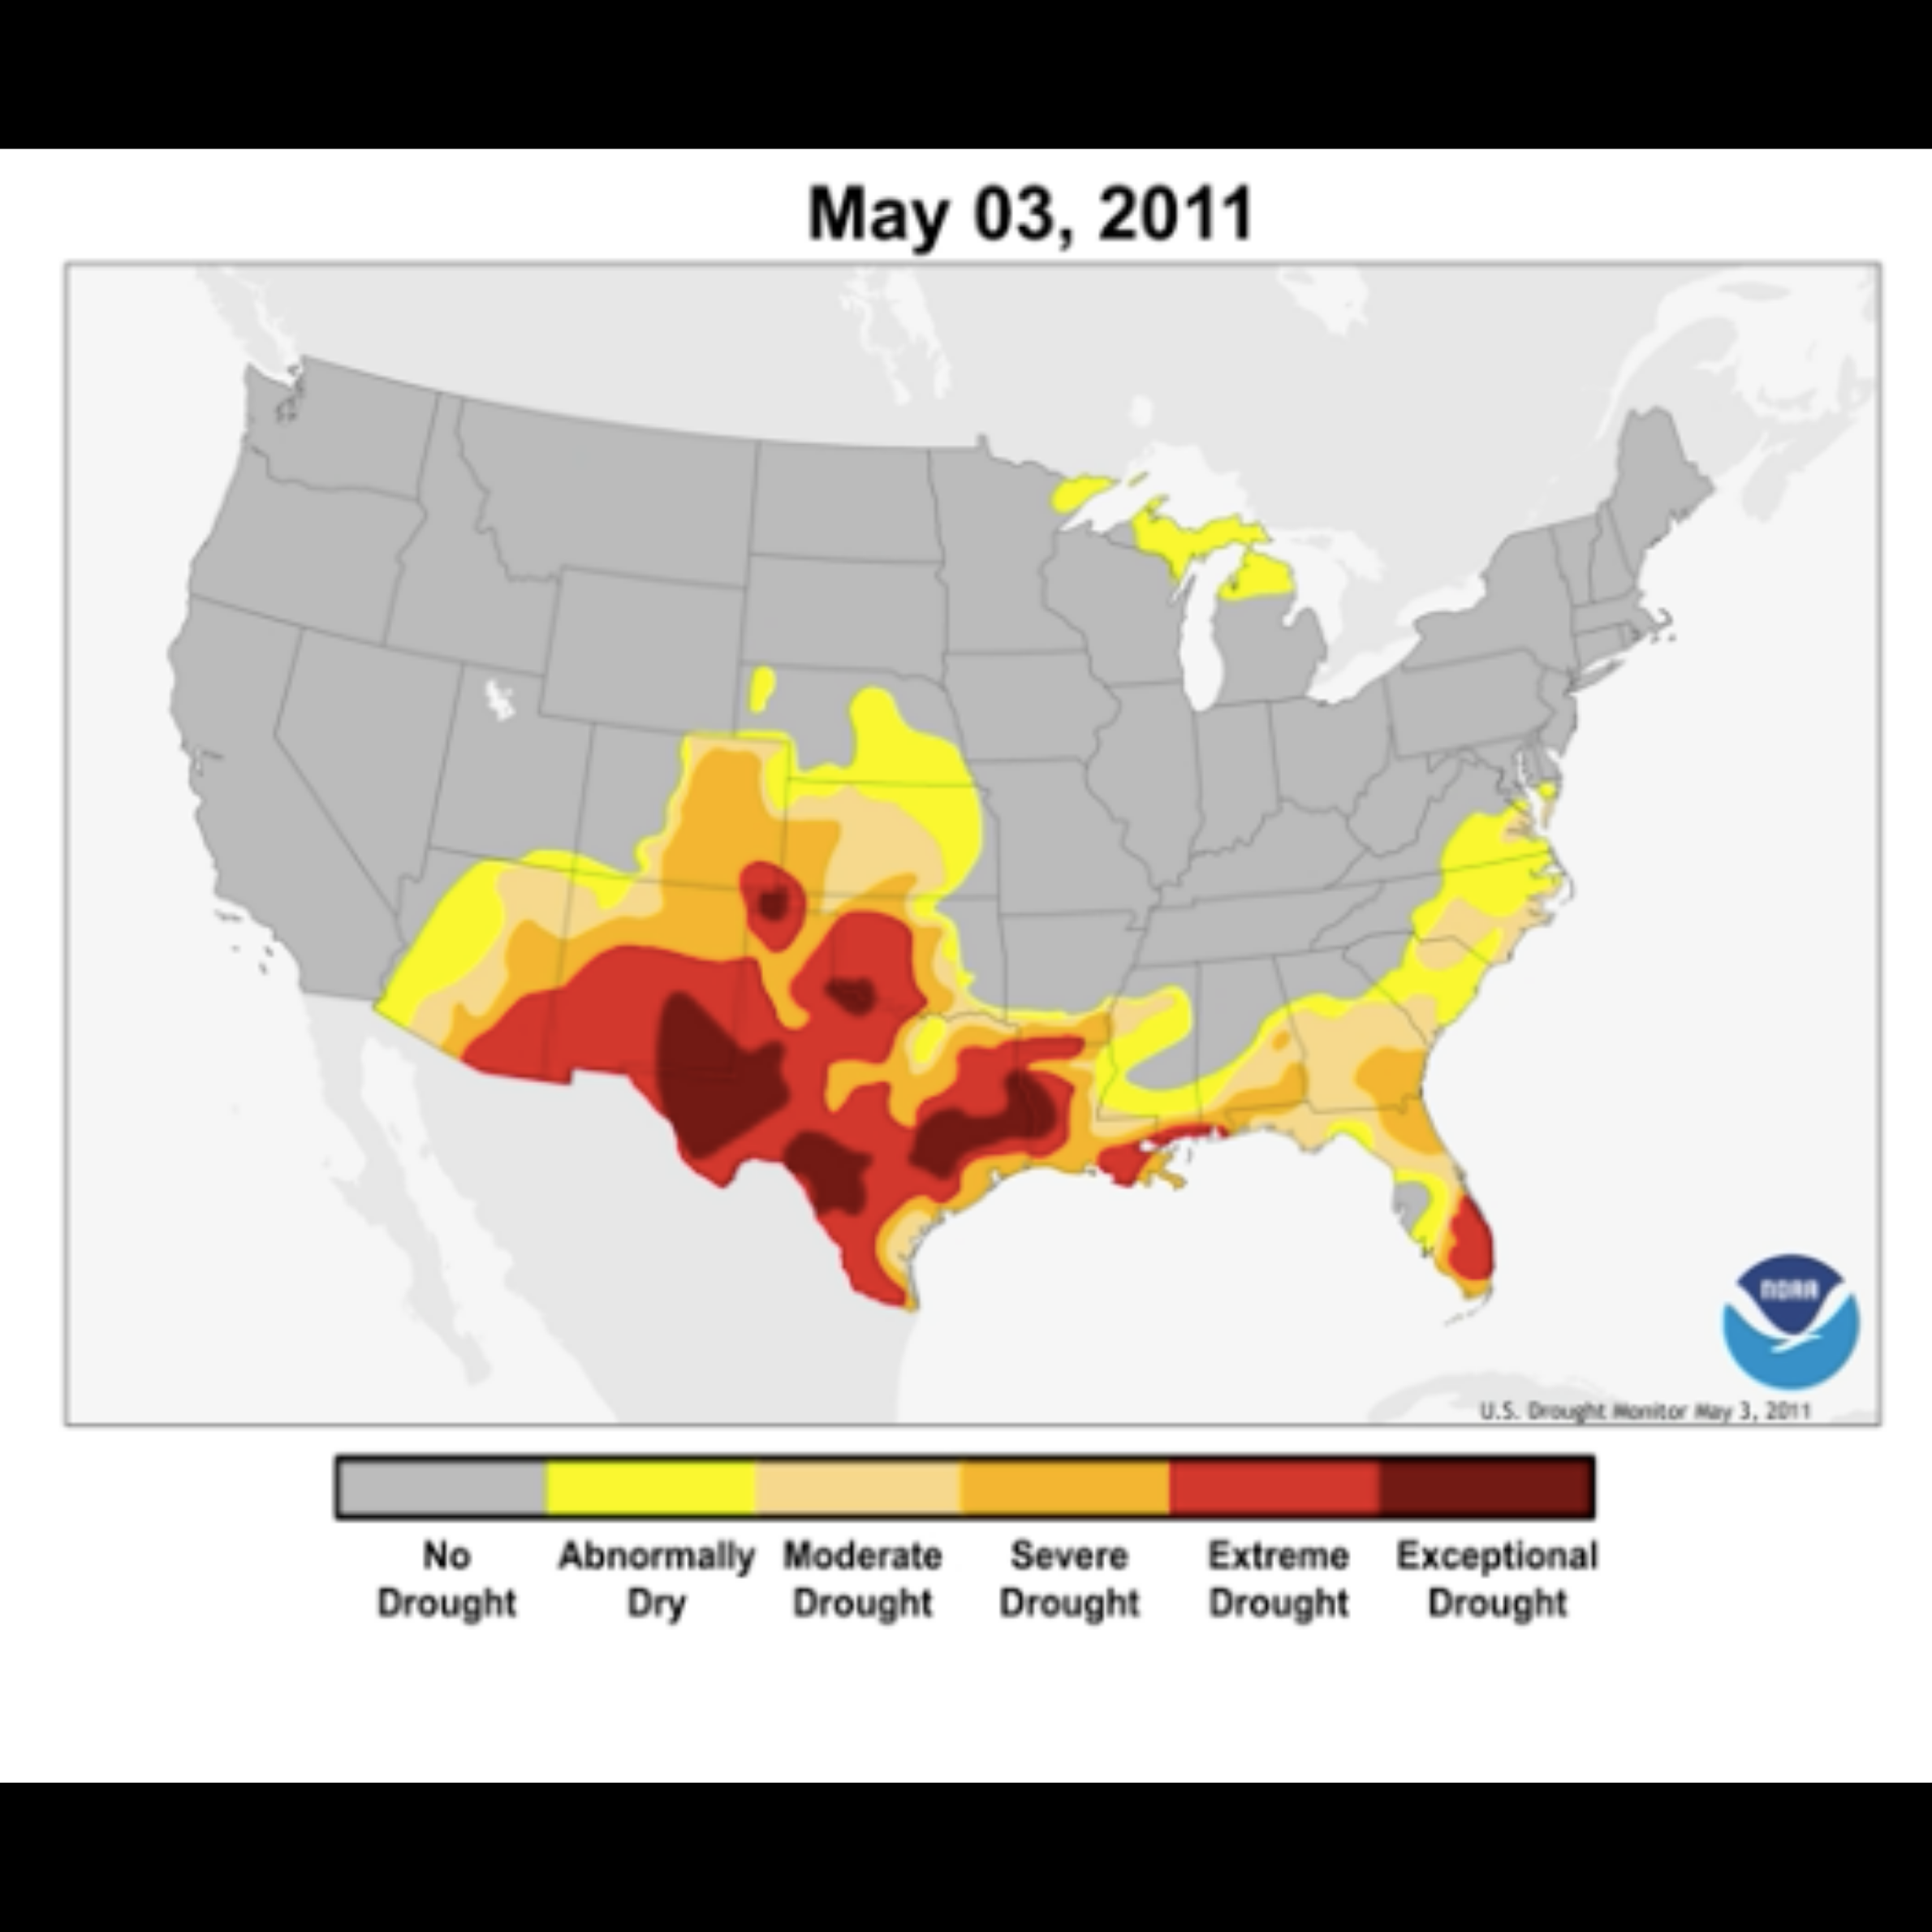
This resource includes 3 videos that are animations of drought data. The first is an animation of the US Drought Monitor drought index snapshots from 2010-2018. The second is an animation of global drought data from satellites from 2013-2018. The third is an animation of drought projections for the US from 1950-2095.
Activity Type
Engage Type
Grade Level
Science Themes