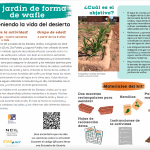
Un jardín de forma de wafle
La gente indígena del suroeste de los Estados Unidos, incluyendo los Diné (Navajo), A:shiwi (Zuni), Zia Pueblo y Laguna Pueblo, han utilizado durante generaciones un método agrícola de probada eficacia conocido como Un jardín de forma de wafle para cultivar con éxito en el entorno semiárido. Esta técnica centenaria integra los ciclos de las…
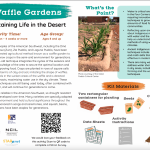
Waffle Garden
Indigenous peoples of the American Southwest, including the Diné (Navajo), A:shiwi (Zuni), Zia Pueblo, and Laguna Pueblo, have been using a time-tested agricultural method known as a waffle garden to successfully grow crops in the semi-arid environment for generations. This centuries-old technique integrates the cycles of the seasons and…
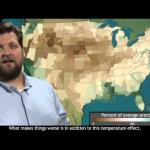
Baking the Bread Basket: Drought in the Heartland
From scorching July heat to well-below-average summer rainfall, NOAA’s Deke Arndt, Chief of the Climate Monitoring Branch at the National Climatic Data Center, recaps summer climate conditions across the United States. Running time: 3:02

Drought in the Colorado River Basin
This application was developed by the U.S. Geological Survey and the Bureau of Reclamation in support of the Department of the Interior’s Open Water Data Initiative (OWDI). This visualization is part of a multi-agency effort to showcase the usefulness of open data (i.e., data provided in a discoverable, sharable, and machine-readable…

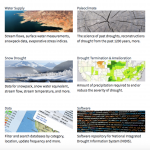
Drought Data and Projections
This resource includes 3 videos that are animations of drought data. The first is an animation of the US Drought Monitor drought index snapshots from 2010-2018. The second is an animation of global drought data from satellites from 2013-2018. The third is an animation of drought projections for the US from 1950-2095.
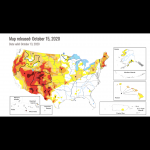
U.S. Drought Monitor
This is a real-time map of current drought conditions in the US, which can be zoomed to the state level, with access to many more resources at that level. Some of these include the National Drought Regional Summaries and animations of historical data.
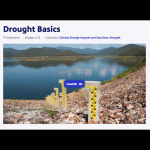
Drought Basics
This PBS Learning Media activity addresses drought basics, including its causes and impacts and ways to assess it, by using media from NOAA and NASA. It defines the types of drought, the impacts, monitoring, and responses to drought. Use this resource to stimulate thinking and questions on the complexity of drought and to identify some variables…
National Integrated Drought Information System: Data, Maps and Tools
This is a extensive collection of maps, data, and tools that students can use to research drought and its impacts on agriculture, wildfires, water supply, vegetation, soil moisture, temperature and precipitation.
Too Much, Too Little
This video describes the joint NASA-JAXA GPM (Global Precipitation Measurement) satellite mission and why it is necessary for monitoring precipitation around the Earth. It also discusses the science around issues of having too much or too little precipitation such as landslides and drought. It emphasizes the need for data to fill in gaps, and why…
Assessing Drought in the United States
This easy-to-understand video animation describes drought and explains the different categories of drought used by the drought monitor. It discusses the effects of and contributions to drought, what the implications of the different drought levels are, and puts the drought maps into context to understand how the impacts vary geographically (e.g.…
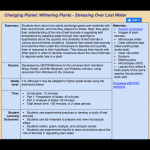
Changing Planet: Withering Crops
This video examines what will happen to crops as Earth's temperature rises and soils dry out because of changing climate. Video length: 5:50 min.
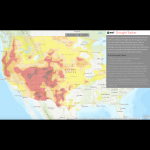
ESRI Drought Tracker
Using US Drought Monitor data and its classification system, this interactive tool tracks drought in the continental US by county, from 2000 to the present.
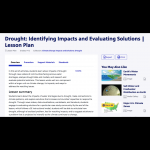
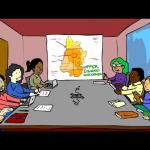
Drought: Identifying Impacts and Evaluating Solutions Lesson Plan
Through this set of lessons, students learn about the impacts of water shortages due to drought, make connections to climate patterns, and explore community resiliency solutions. The lessons engage students in evaluating solutions for a particular case study community. Students will need to do additional research on solutions, but by the end of…