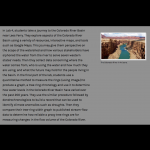
Sharing a River - The Colorado River Story
Students explore aspects of the Colorado River Basin using a variety of resources, interactive maps, and tools such as Google Maps.
Learn More
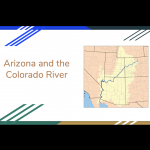
Arizona and the Colorado River
In this activity, students will learn about the dams and major cities on the Colorado River. They will research why the dams were built and discuss how hydrology plays such a great part in the geography of Arizona.
Learn More

The Colorado River Water Story
The Colorado River watershed has always been a subject of great interest and concern. It provides agricultural irrigation and drinking water to farms and cities in seven southwestern states. The intention of this exercise is to be a southwestern regional perspective of a changing climate.
Learn More

Hoover Dam and Hydroelectric Power
Since its completion, Hoover Dam has wowed visitors with its sheer massiveness and its ability to create and hold back a reservoir that covers nearly 650 square kilometers (250 square miles). Yet, perhaps even more impressive is the dam's ability to harness the potential energy stored in the reservoir and convert it to electricity. In this video segment, adapted from Building Big, series host David Macaulay explores Hoover Dam's hydroelectric capabilities.
Learn More
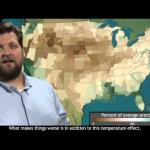
Baking the Bread Basket: Drought in the Heartland
From scorching July heat to well-below-average summer rainfall, NOAA’s Deke Arndt, Chief of the Climate Monitoring Branch at the National Climatic Data Center, recaps summer climate conditions across the United States.
Learn More

Drought in the Colorado River Basin
This application was developed by the U.S. Geological Survey and the Bureau of Reclamation in support of the Department of the Interior’s Open Water Data Initiative (OWDI). This visualization is part of a multi-agency effort to showcase the usefulness of open data (i.e., data provided in a discoverable, sharable, and machine-readable format) by exploring the current 16-year drought and its effects on the Colorado River Basin.
Learn More
The Hardest Working River in the West
A StoryMap Exploring the Colorado River Through Data.
Learn More

Drought Data and Projections
This resource includes 3 videos that are animations of drought data. The first is an animation of the US Drought Monitor drought index snapshots from 2010-2018. The second is an animation of global drought data from satellites from 2013-2018. The third is an animation of drought projections for the US from 1950-2095.
Learn More
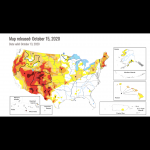
U.S. Drought Monitor
This is a real-time map of current drought conditions in the US, which can be zoomed to the state level, with access to many more resources at that level. Some of these include the National Drought Regional Summaries and animations of historical data.
Learn More
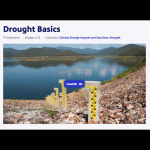
Drought Basics
This PBS Learning Media activity addresses drought basics, including its causes and impacts and ways to assess it, by using media from NOAA and NASA.
Learn More