
Drought in the Colorado River Basin
This application was developed by the U.S. Geological Survey and the Bureau of Reclamation in support of the Department of the Interior’s Open Water Data Initiative (OWDI). This visualization is part of a multi-agency effort to showcase the usefulness of open data (i.e., data provided in a discoverable, sharable, and machine-readable…
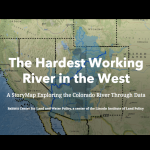
The Hardest Working River in the West
This is a StoryMap on the Colorado River. The story map details the history of the Colorado River, water resources, river management, and tools for managing in the future.
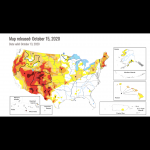
U.S. Drought Monitor
This is a real-time map of current drought conditions in the US, which can be zoomed to the state level, with access to many more resources at that level. Some of these include the National Drought Regional Summaries and animations of historical data.

SciJinks: Precipitation Simulator
A computer simulator that allows students to adjust the air temperature and dew point to see what type of precipitation would fall to the ground.
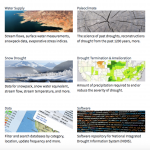
National Integrated Drought Information System: Data, Maps and Tools
This is a extensive collection of maps, data, and tools that students can use to research drought and its impacts on agriculture, wildfires, water supply, vegetation, soil moisture, temperature and precipitation.
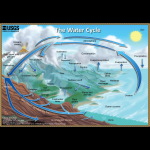
The Water Cycle
This visualization, from the US Geological Survey, provides a simple schematic of the various pathways that water can take as it cycles through ocean, lakes, atmosphere, surface and ground.
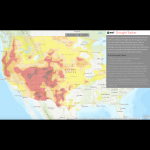
ESRI Drought Tracker
Using US Drought Monitor data and its classification system, this interactive tool tracks drought in the continental US by county, from 2000 to the present.
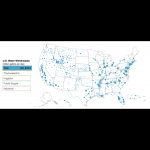
Water Use in the U.S.
An interactive data visualization map of the USGS data of water usage from 2015 of the USA and US territories.