Explore our collection of hands-on and virtual activities for youth, families and adults to learn more about how water affects our planet and communities!
Use the search function to find just the right activity for you.
Controlling the Flow of the Colorado River
Students will learn about the Colorado River and human efforts to control water flow. Students will then research other water management efforts throughout the country and report their findings.
Created by: Utah Education Network
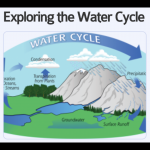
Exploring the Water Cycle
In this lesson, students will learn about the water cycle and how energy from the sun and the force of gravity drive this cycle.
Created by: National Aeronautics and Space Administration, Global Precipitation Measurement
The Water Cycle: Now You See It, Now You Don't
This lesson is an instructor demonstration that focuses specifically on two aspects of the water cycle: evaporation and condensation. This is a well described instructor led demonstration for introducing and exploring the water cycle.
Created by: Aquarius Education and Public Outreach, National Aeronautics and Space Administration
Water Water Everywhere
This classroom demonstration illustrates the amount of water stored in various parts of the Earth system in a straightforward manner.
Created by: National Weather Service
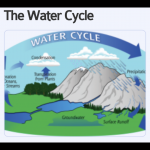
The Water Cycle
This activity was developed to give participants an understanding of Earth's water cycle by completing a WebQuest and building a model of the water cycle.
Created by: National Aeronautics and Space Administration, Global Precipitation Measurement
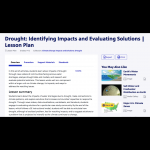
Drought: Identifying Impacts and Evaluating Solutions Lesson Plan
Through this set of lessons, students learn about the impacts of water shortages due to drought, make connections to climate patterns, and explore community resiliency solutions.
Created by: Public Broadcasting Service Learning Media
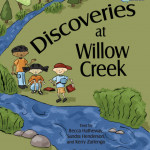
Elementary GLOBE Water Module
Students learn about the water cycle and hydrology through a series of three lessons, two coloring book pages, and an e-Book.
Created by: Becca Hatheway, Kerry Zarlengo, Lisa Gardiner, Sandra Henderson, The University Cooperation for Atmospheric Research

Tracking Water Using NASA Satellite Data
Using real data from NASA's GRACE satellites, students will track water mass changes in the U.S., data that measures changes in ice, surface and especially groundwater.
Created by: Jet Propulsion Laboratory, National Aeronautics and Space Administration
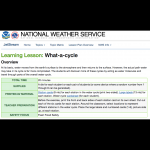
What-a-cycle
In this activity, students act as water molecules and travel through parts of the water cycle (ocean, atmosphere, clouds, glaciers, snow, rivers, lakes, ground, aquifer). Students use a diagram of the hydrologic cycle to draw the pathway they traveled.
Created by: Jetstream - On-line School for Weather, NOAJetstream - On-line School for Weather, NOAA - National Weather ServiceA - National Weather Service
Evaporation Investigation
Students observe the process of evaporation, make comparisons about the process, then construct a diagram and use it to describe the process of evaporation.
Created by: Aquarius, National Aeronautics and Space Administration
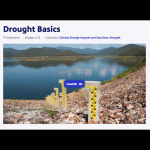
Drought Basics
This PBS Learning Media activity addresses drought basics, including its causes and impacts and ways to assess it, by using media from NOAA and NASA.
Created by: PBS, WGBH Educational Foundation
Colorado River water supply
This activity addresses climate change impacts that affect all states that are part of the Colorado River Basin and are dependent on its water.
Created by: Patricia Mynster, David Hassenzahl, Encyclopedia of Earth
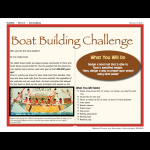
Boat Building Challenge
Use aluminum foil to make boats and then test designs by seeing how many pennies or paperclips they can hold.
Created by: National Oceanic and Atmospheric Administration
A Drop in Your Hand - Water Stewardship Activity
See the relative volume of water available that is clean, safe, and available to drink.
Created by: National Oceanic and Atmospheric Administration
Can You Catch The Water?
Students construct three-dimensional models of water catchment basins using everyday objects to form hills, mountains, valleys and water sources.
Created by: University of Colorado Teach Engineering
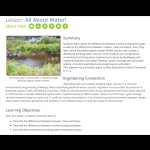
All About Water!
Students learn about the differences between surface and ground water as well as the differences between streams, rivers and lakes. Then, they learn about dissolved organic matter (DOM) and the role it plays in identifying drinking water sources. Then students are introduced to conventional drinking water treatment processes by developing and implementing their own water filtration system through the associated activity.
Created by: University of Colorado Teach Engineering
Sharing a River - The Colorado River Story
Students explore aspects of the Colorado River Basin using a variety of resources, interactive maps, and tools such as Google Maps.
Created by: Science Education Resource Center at Carleton College
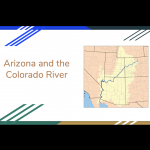
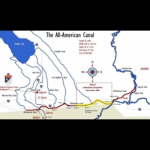
Arizona and the Colorado River
In this activity, students will learn about the dams and major cities on the Colorado River. They will research why the dams were built and discuss how hydrology plays such a great part in the geography of Arizona.
Created by: Arizona State University, Arizona Geographic Alliance
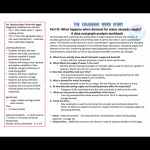
The Colorado River Water Story
The Colorado River watershed has always been a subject of great interest and concern. It provides agricultural irrigation and drinking water to farms and cities in seven southwestern states. The intention of this exercise is to be a southwestern regional perspective of a changing climate.
Created by: National Oceanic and Atmospheric Administration
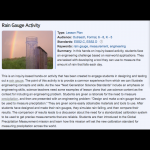
Rain Gauge Activity
In this hands-on inquiry-based activity, students face an engineering challenge based on real-world applications. They are tasked with developing a tool they can use to measure the amount of rain that falls each day. This is more of a mini unit than a stand alone activity.
Created by: National Aeronautics and Space Administration, Global Precipitation Measurement
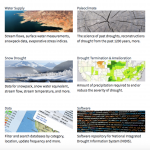
National Integrated Drought Information System: Data, Maps and Tools
This is a extensive collection of maps, data, and tools that students can use to research drought and its impacts on agriculture, wildfires, water supply, vegetation, soil moisture, temperature and precipitation.
Created by: National Integrated Drought Information System (NIDIS)
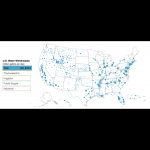
Water Use in the U.S.
An interactive data visualization map of the USGS data of water usage from 2015 of the USA and US territories.
Created by: United States Geologic Survey
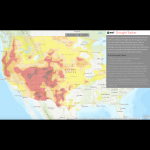
ESRI Drought Tracker
Using US Drought Monitor data and its classification system, this interactive tool tracks drought in the continental US by county, from 2000 to the present.
Created by: ESRI, National Drought Mitigation Center
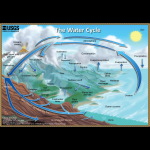
The Water Cycle
This visualization, from the US Geological Survey, provides a simple schematic of the various pathways that water can take as it cycles through ocean, lakes, atmosphere, surface and ground.
Created by: US Geological Service (USGS)

Drought in the Colorado River Basin
This application was developed by the U.S. Geological Survey and the Bureau of Reclamation in support of the Department of the Interior’s Open Water Data Initiative (OWDI). This visualization is part of a multi-agency effort to showcase the usefulness of open data (i.e., data provided in a discoverable, sharable, and machine-readable format) by exploring the current 16-year drought and its effects on the Colorado River Basin.
Created by: U.S. Department of the Interior
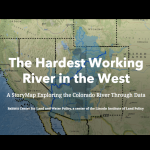
The Hardest Working River in the West
A StoryMap Exploring the Colorado River Through Data.
Created by: Babbitt Center for Land and Water Policy
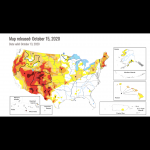
U.S. Drought Monitor
This is a real-time map of current drought conditions in the US, which can be zoomed to the state level, with access to many more resources at that level. Some of these include the National Drought Regional Summaries and animations of historical data.
Created by: Richard Heim, Liz Love-Brotak, National Drought Mitigation Center

SciJinks: Precipitation Simulator
A computer simulator that allows students to adjust the air temperature and dew point to see what type of precipitation would fall to the ground.
Created by: Tom Whittaker, Cooperative Institute for Meteorological Satellite Studies, University of Wisconsin Madison, SciJinks; National Oceanic and Atmospheric Administration

Water Demand for Urban Areas
In this lecture, Dr. Joanna Endter-Wada from Utah State University discusses water demand for urban areas. Learn about the nature of urban water demand, urban water management, and more. This is part of the Water in the Western US lecture series.
Created by: University of Colorado, Boulder

Water Demand for Agriculture
Dr. Reagan Waskom, director of the Colorado Water Institute at Colorado State University, provides an overview on agricultural water use in the west. Learn about types of agriculture, how water is used in agriculture, and why so much water is needed for agriculture in the west. This video is part of the Water in the Western US lecture series.
Created by: University of Colorado, Boulder